Announcing VDBBench 1.0: Open-Source Vector Database Benchmarking with Your Real-World Production Workloads
Most vector database benchmarks test with static data and pre-built indexes. But production systems don’t work that way—data flows continuously while users run queries, filters fragment indexes, and performance characteristics shift dramatically under concurrent read/write loads.
Today we’re releasing VDBBench 1.0, an open-source benchmark designed from the ground up to test vector databases under realistic production conditions: streaming data ingestion, metadata filtering with varying selectivity, and concurrent workloads that reveal actual system bottlenecks.
Download VDBBench 1.0 → | View Leaderboard →
Why Current Benchmarks Are Misleading
Let’s be honest—there’s a strange phenomenon in our industry. Everyone talks about “not gaming benchmarks,” yet many participate in exactly that behavior. Since the vector database market exploded in 2023, we’ve seen numerous examples of systems that “benchmark beautifully” but “fail miserably” in production, wasting engineering time and damaging project credibility.
We’ve witnessed this disconnect firsthand. For example, Elasticsearch boasts millisecond-level query speeds, but behind the scenes, it can take over 20 hours just to optimize its index. What production system can tolerate such downtime?
The problem stems from three fundamental flaws:
Outdated datasets: Many benchmarks still rely on legacy datasets like SIFT (128 dimensions) while modern embeddings range from 768-3,072 dimensions. The performance characteristics of systems operating on 128D vs. 1024D+ vectors are fundamentally different—memory access patterns, index efficiency, and computational complexity all change dramatically.
Vanity metrics: Benchmarks focus on average latency or peak QPS, creating a distorted picture. A system with 10ms average latency but 2-second P99 latency creates a terrible user experience. Peak throughput measured over 30 seconds tells you nothing about sustained performance.
Oversimplified scenarios: Most benchmarks test basic “write data, build index, query” workflows—essentially “Hello World” level testing. Real production involves continuous data ingestion while serving queries, complex metadata filtering that fragments indexes, and concurrent read/write operations competing for resources.
What’s New in VDBBench 1.0?
VDBBench doesn’t just iterate on outdated benchmarking philosophies—it rebuilds the concept from first principles with one guiding belief: a benchmark is only valuable if it predicts actual production behavior.
We’ve engineered VDBBench to faithfully replicate real-world conditions across three critical dimensions: data authenticity, workload patterns, and performance measurement methodologies.
Let’s take a closer look at what new features are brought to the table.
🚀 Redesigned Dashboard with Production-Relevant Visualizations
Most benchmarks focus only on raw data output, but what matters is how engineers interpret and act on those results. We redesigned the UI to prioritize clarity and interactivity—enabling you to spot performance gaps between systems and make fast infrastructure decisions.
The new dashboard visualizes not just performance numbers, but the relationships between them: how QPS degrades under different filter selectivity levels, how recall fluctuates during streaming ingestion, and how latency distributions reveal system stability characteristics.
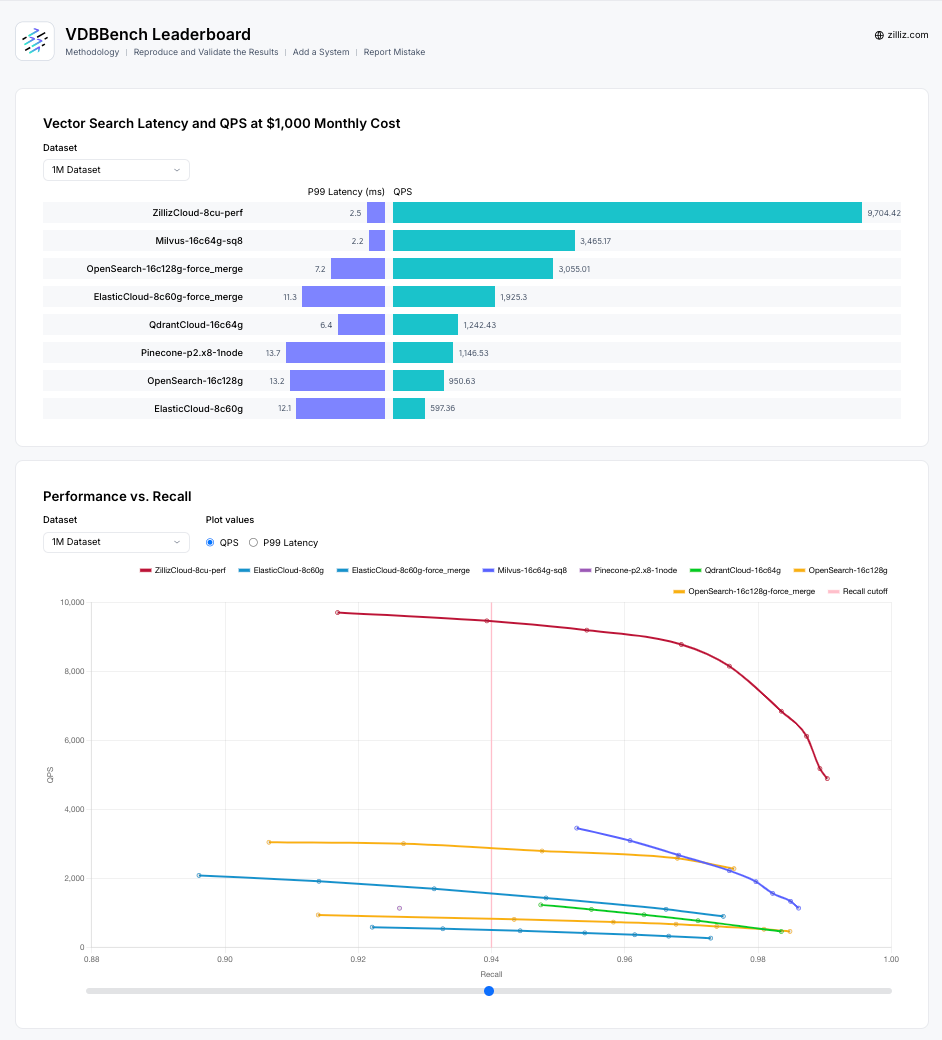
We’ve retested major vector database platforms including Milvus, Zilliz Cloud, Elastic Cloud, Qdrant Cloud, Pinecone, and OpenSearch with their latest configurations and recommended settings, ensuring all benchmark data reflects current capabilities. All testing results are available at the VDBBench Leaderboard.
🏷️ Tag Filtering: The Hidden Performance Killer
Real-world queries rarely happen in isolation. Applications combine vector similarity with metadata filtering (“find shoes that look like this photo but cost under $100”). This filtered vector search creates unique challenges that most benchmarks completely ignore.
Filtered searches introduce complexity in two critical areas:
Filter Complexity: More scalar fields and complex logical conditions increase computational demands and can cause insufficient recall and graph index fragmentation.
Filter Selectivity: This is the “hidden performance killer” we’ve repeatedly verified in production. When filtering conditions become highly selective (filtering out 99%+ of data), query speeds can fluctuate by orders of magnitude, and recall can become unstable as index structures struggle with sparse result sets.
VDBBench systematically tests various filtering selectivity levels (from 50% to 99.9%), providing a comprehensive performance profile under this critical production pattern. The results often reveal dramatic performance cliffs that would never show up in traditional benchmarks.
Example: In Cohere 1M tests, Milvus maintained consistently high recall across all filter selectivity levels, while OpenSearch exhibited unstable performance with recall fluctuating significantly under different filtering conditions—falling below 0.8 recall in many cases, which is unacceptable for most production environments.
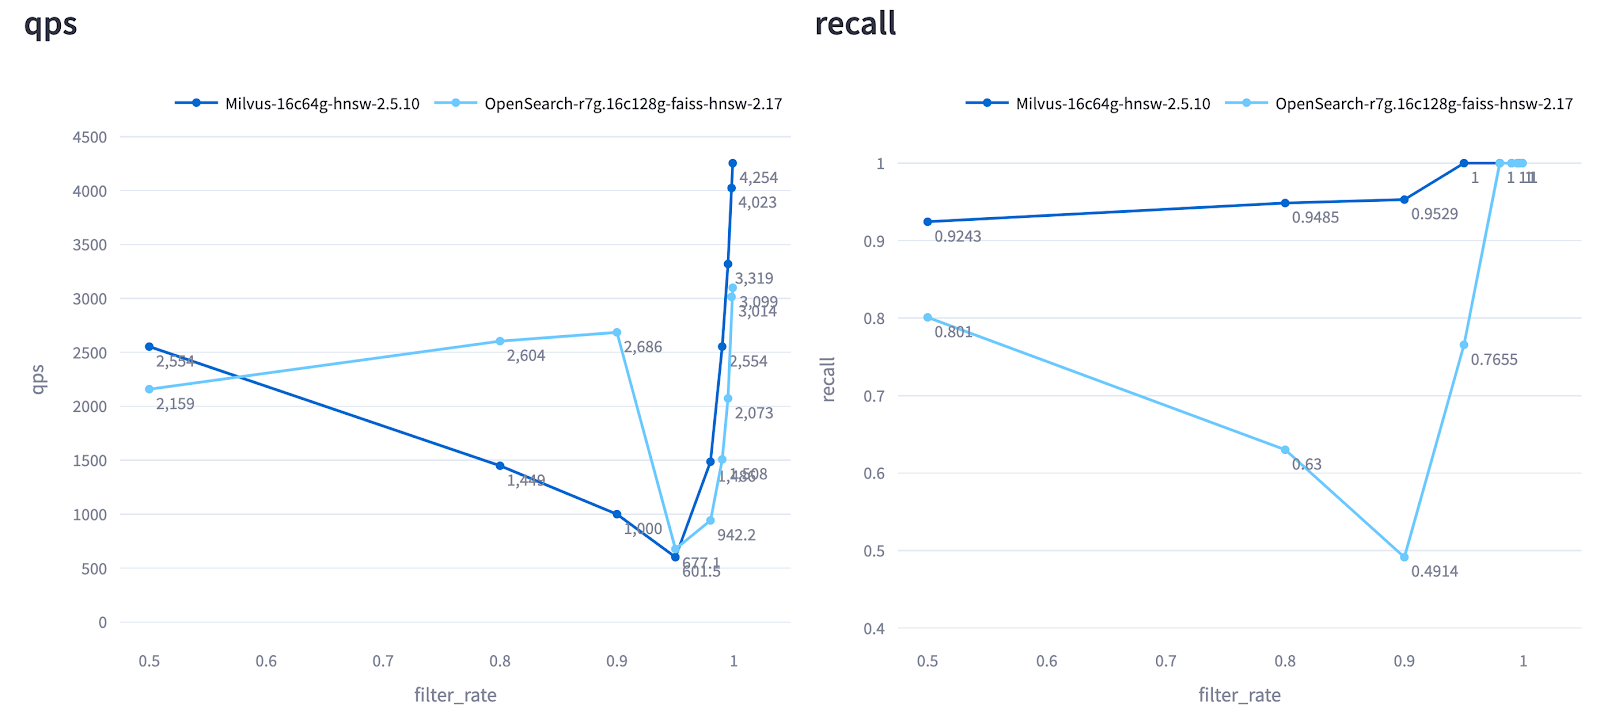
Figure: QPS and Recall of Milvus and OpenSearch Across Different Filter Selectivity Levels (Cohere 1M Test).
🌊 Streaming Read/Write: Beyond Static Index Testing
Production systems rarely enjoy the luxury of static data. New information continuously flows in while searches execute—a scenario where many otherwise impressive databases collapse under the dual pressure of maintaining search performance while handling continuous writes.
VDBBench’s streaming scenarios simulate real parallel operations, helping developers understand system stability in high-concurrency environments, particularly how data writing impacts query performance and how performance evolves as data volume increases.
To ensure fair comparisons across different systems, VDBBench uses a structured approach:
Configure controlled write rates that mirror target production workloads (e.g., 500 rows/sec distributed across 5 parallel processes)
Trigger search operations after every 10% of data ingestion, alternating between serial and concurrent modes
Record comprehensive metrics: latency distributions (including P99), sustained QPS, and recall accuracy
Track performance evolution over time as data volume and system stress increase
This controlled, incremental load testing reveals how well systems maintain stability and accuracy under ongoing ingestion—something traditional benchmarks rarely capture.
Example: In Cohere 10M streaming tests, Pinecone maintained higher QPS and recall throughout the write cycle compared to Elasticsearch. Notably, Pinecone’s performance significantly improved after ingestion completion, demonstrating strong stability under sustained load, while Elasticsearch showed more erratic behavior during active ingestion phases.
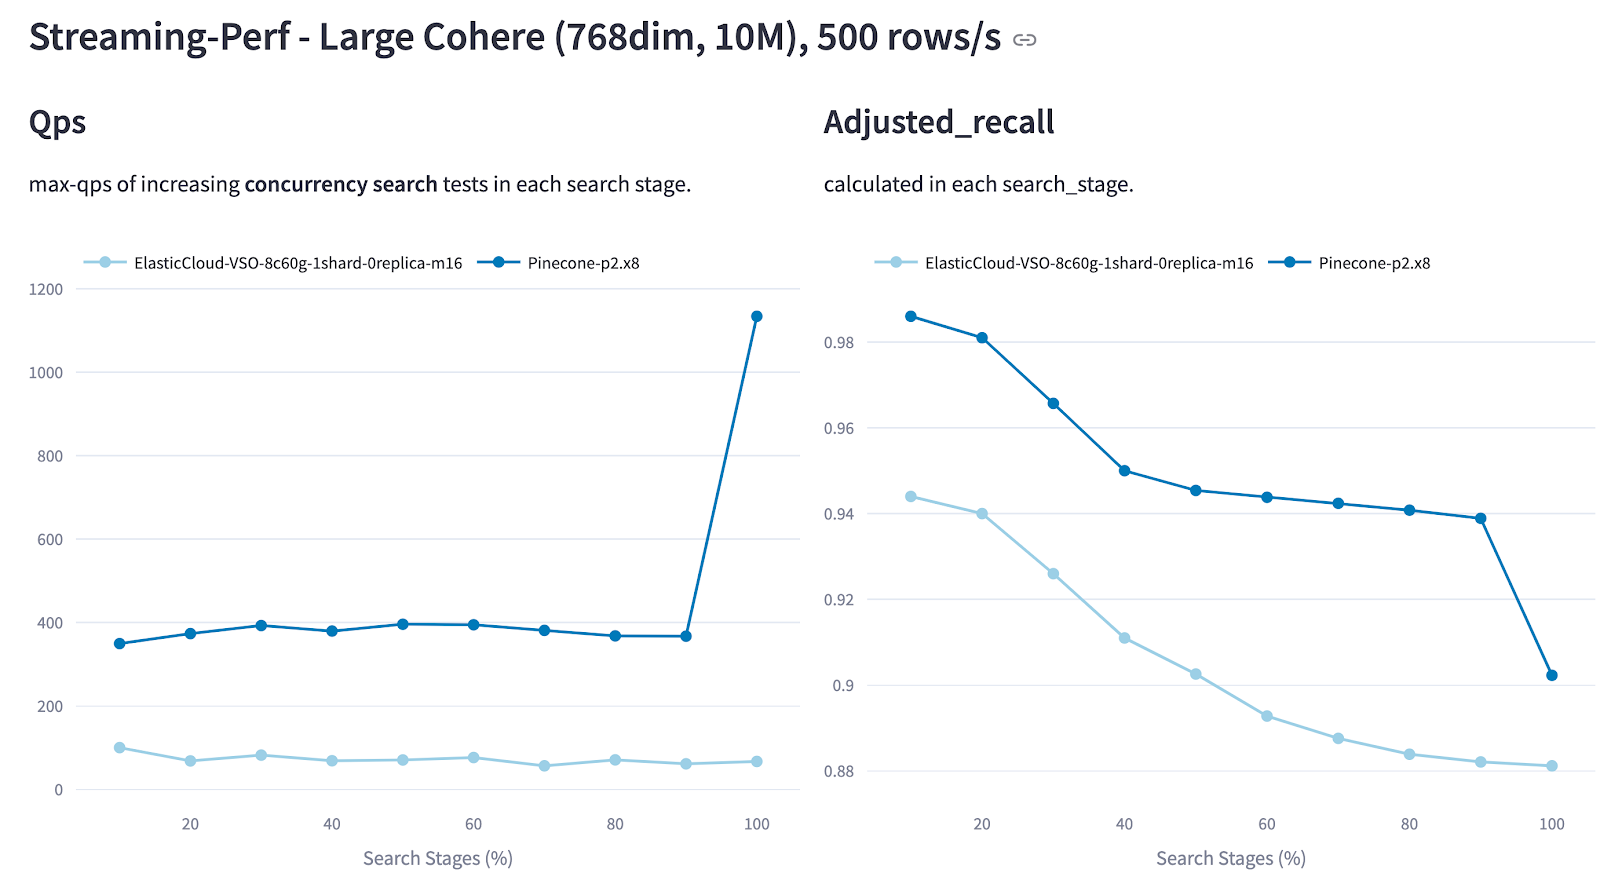
Figure: QPS and Recall of Pinecone vs. Elasticsearch in the Cohere 10M Streaming Test (500 rows/s Ingestion Rate).
VDBBench goes even further by supporting an optional optimization step, allowing users to compare streaming search performance before and after index optimization. It also tracks and reports the actual time spent on each stage, offering deeper insights into system efficiency and behavior under production-like conditions.
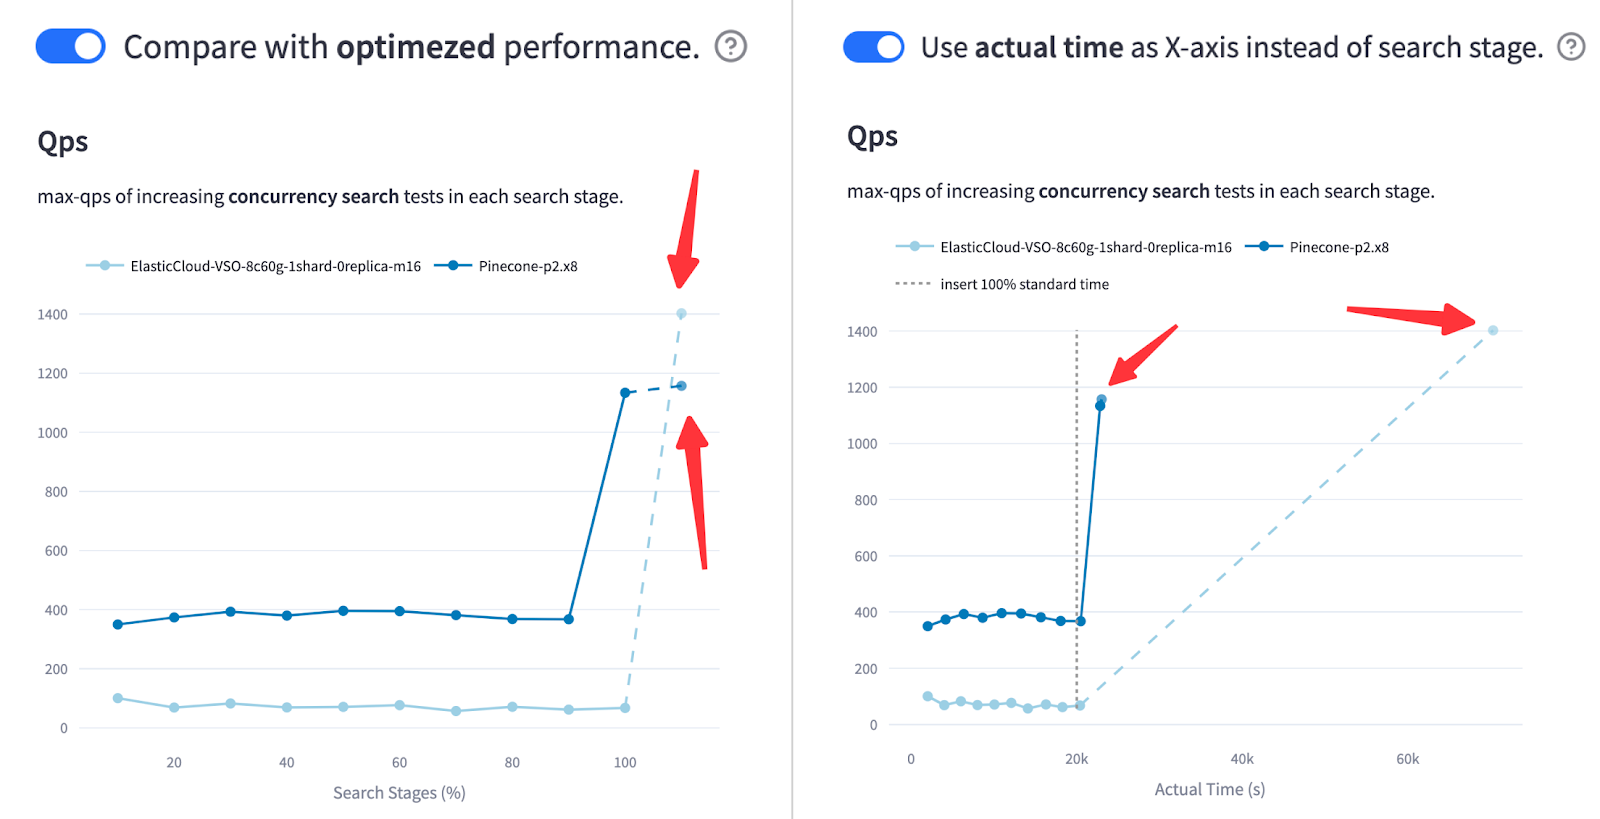
Figure: QPS and Recall of Pinecone vs. Elasticsearch in the Cohere 10M Streaming Test After Optimization (500 rows/s Ingestion Rate)
As shown in our tests, Elasticsearch surpassed Pinecone in QPS—after index optimization. But when the x-axis reflects actual elapsed time, it’s clear that Elasticsearch took significantly longer to reach that performance. In production, that delay matters. This comparison reveals a key tradeoff: peak throughput vs. time-to-serve.
🔬 Modern Datasets That Reflect Current AI Workloads
We’ve completely overhauled the datasets used for vector database benchmarking. Instead of legacy test sets like SIFT and GloVe, VDBBench uses vectors generated from state-of-the-art embedding models like OpenAI and Cohere that power today’s AI applications.
To ensure relevance, especially for use cases like Retrieval-Augmented Generation (RAG), we selected corpora that reflect real-world enterprise and domain-specific scenarios:
| Corpus | Embedding Model | Dimensions | Size | Use Case |
| Wikipedia | Cohere V2 | 768 | 1M / 10M | General knowledge base |
| BioASQ | Cohere V3 | 1024 | 1M / 10M | Domain-specific (biomedical) |
| C4 | OpenAI | 1536 | 500K / 5M | Web-scale text processing |
| MSMarco V2 | udever-bloom-1b1 | 1536 | 1M / 10M / 138M | Large-scale search |
These datasets better simulate today’s high-volume, high-dimensional vector data, enabling realistic testing of storage efficiency, query performance, and retrieval accuracy under conditions that match modern AI workloads.
⚙️ Custom Dataset Support for Industry-Specific Testing
Every business is unique. The financial industry might need testing focused on transaction embeddings, while social platforms care more about user behavior vectors. VDBBench lets you benchmark with your own data generated from your specific embedding models for your specific workloads.
You can customize:
Vector dimensions and data types
Metadata schema and filtering patterns
Data volume and ingestion patterns
Query distributions that match your production traffic
After all, no dataset tells a better story than your own production data.
How VDBBench Measures What Actually Matters in Production
Production-Focused Metric Design
VDBBench prioritizes metrics that reflect real-world performance, not just lab results. We’ve redesigned benchmarking around what actually matters in production environments: reliability under load, tail latency characteristics, sustained throughput, and accuracy preservation.
P95/P99 Latency for Real User Experience: Average/median latency masks the outliers that frustrate real users and can indicate underlying system instability. VDBBench focuses on tail latency like P95/P99, revealing what performance 95% or 99% of your queries will actually achieve. This is crucial for SLA planning and understanding worst-case user experience.
Sustainable Throughput Under Load: A system that performs well for 5 seconds doesn’t cut it in production. VDBBench gradually increases concurrency to find your database’s maximum sustainable queries per second (
max_qps)—not the peak number under short, ideal conditions. This methodology reveals how well your system holds up over time and helps with realistic capacity planning.Recall Balanced with Performance: Speed without accuracy is meaningless. Every performance number in VDBBench is paired with recall measurements, so you know exactly how much relevance you’re trading off for throughput. This enables fair, apples-to-apples comparisons between systems with vastly different internal tradeoffs.
Test Methodology That Reflects Reality
A key innovation in VDBBench’s design is the separation of serial and concurrent testing, which helps capture how systems behave under different types of load and reveals performance characteristics that matter for different use cases.
Latency Measurement Separation:
serial_latency_p99measures system performance under minimal load, where only one request is processed at a time. This represents the best-case scenario for latency and helps identify baseline system capabilities.conc_latency_p99captures system behavior under realistic, high-concurrency conditions, where multiple requests arrive simultaneously and compete for system resources.
Two-Phase Benchmark Structure:
Serial Test: Single-process run of 1,000 queries that establishes baseline performance and accuracy, reporting both
serial_latency_p99and recall. This phase helps identify the theoretical performance ceiling.Concurrency Test: Simulates production environment under sustained load with several key innovations:
Realistic client simulation: Each test process operates independently with its own connection and query set, avoiding shared-state interference that could distort results
Synchronized start: All processes begin simultaneously, ensuring measured QPS accurately reflects claimed concurrency levels
Independent query sets: Prevents unrealistic cache hit rates that don’t reflect production query diversity
These carefully structured methods ensure that max_qps and conc_latency_p99 values reported by VDBBench are both accurate and production-relevant, providing meaningful insights for production capacity planning and system design.
Getting Started with VDBBench 1.0
VDBBench 1.0 represents a fundamental shift toward production-relevant benchmarking. By covering continuous data writing, metadata filtering with varying selectivity, and streaming loads under concurrent access patterns, it provides the closest approximation to actual production environments available today.
The gap between benchmark results and real-world performance shouldn’t be a guessing game. If you’re planning to deploy a vector database in production, it’s worth understanding how it performs beyond idealized lab tests. VDBBench is open-source, transparent, and designed to support meaningful, apples-to-apples comparisons.
Don’t be swayed by impressive numbers that don’t translate to production value. Use VDBBench 1.0 to test scenarios that matter to your business, with your data, under conditions that reflect your actual workload. The era of misleading benchmarks in vector database evaluation is ending—it’s time to make decisions based on production-relevant data.
Try VDBBench with your own workloads: https://github.com/zilliztech/VectorDBBench
View testing results of major vector databases: VDBBench Leaderboard
Have questions or want to share your results? Join the conversation on GitHub or connect with our community on Discord.
- Why Current Benchmarks Are Misleading
- What’s New in VDBBench 1.0?
- 🚀 Redesigned Dashboard with Production-Relevant Visualizations
- 🏷️ Tag Filtering: The Hidden Performance Killer
- 🌊 Streaming Read/Write: Beyond Static Index Testing
- 🔬 Modern Datasets That Reflect Current AI Workloads
- ⚙️ Custom Dataset Support for Industry-Specific Testing
- How VDBBench Measures What Actually Matters in Production
- Production-Focused Metric Design
- Test Methodology That Reflects Reality
- Getting Started with VDBBench 1.0
On This Page
Try Managed Milvus for Free
Zilliz Cloud is hassle-free, powered by Milvus and 10x faster.
Get StartedLike the article? Spread the word