
What Hyperbolic Geometry Does to Ranking
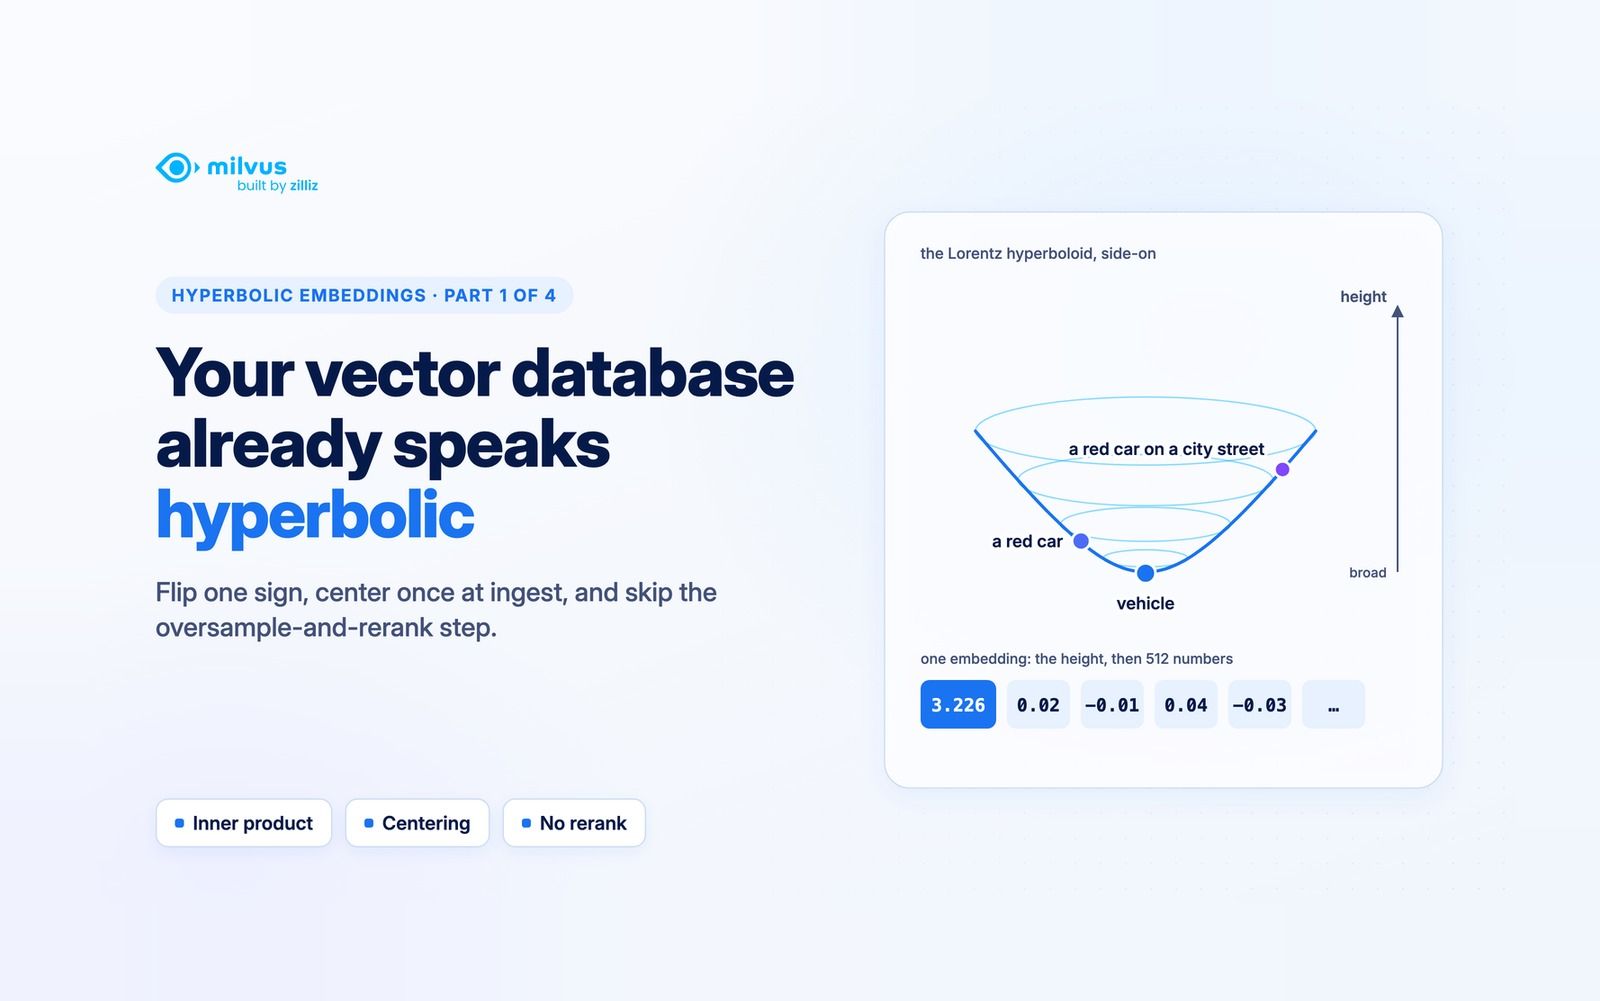
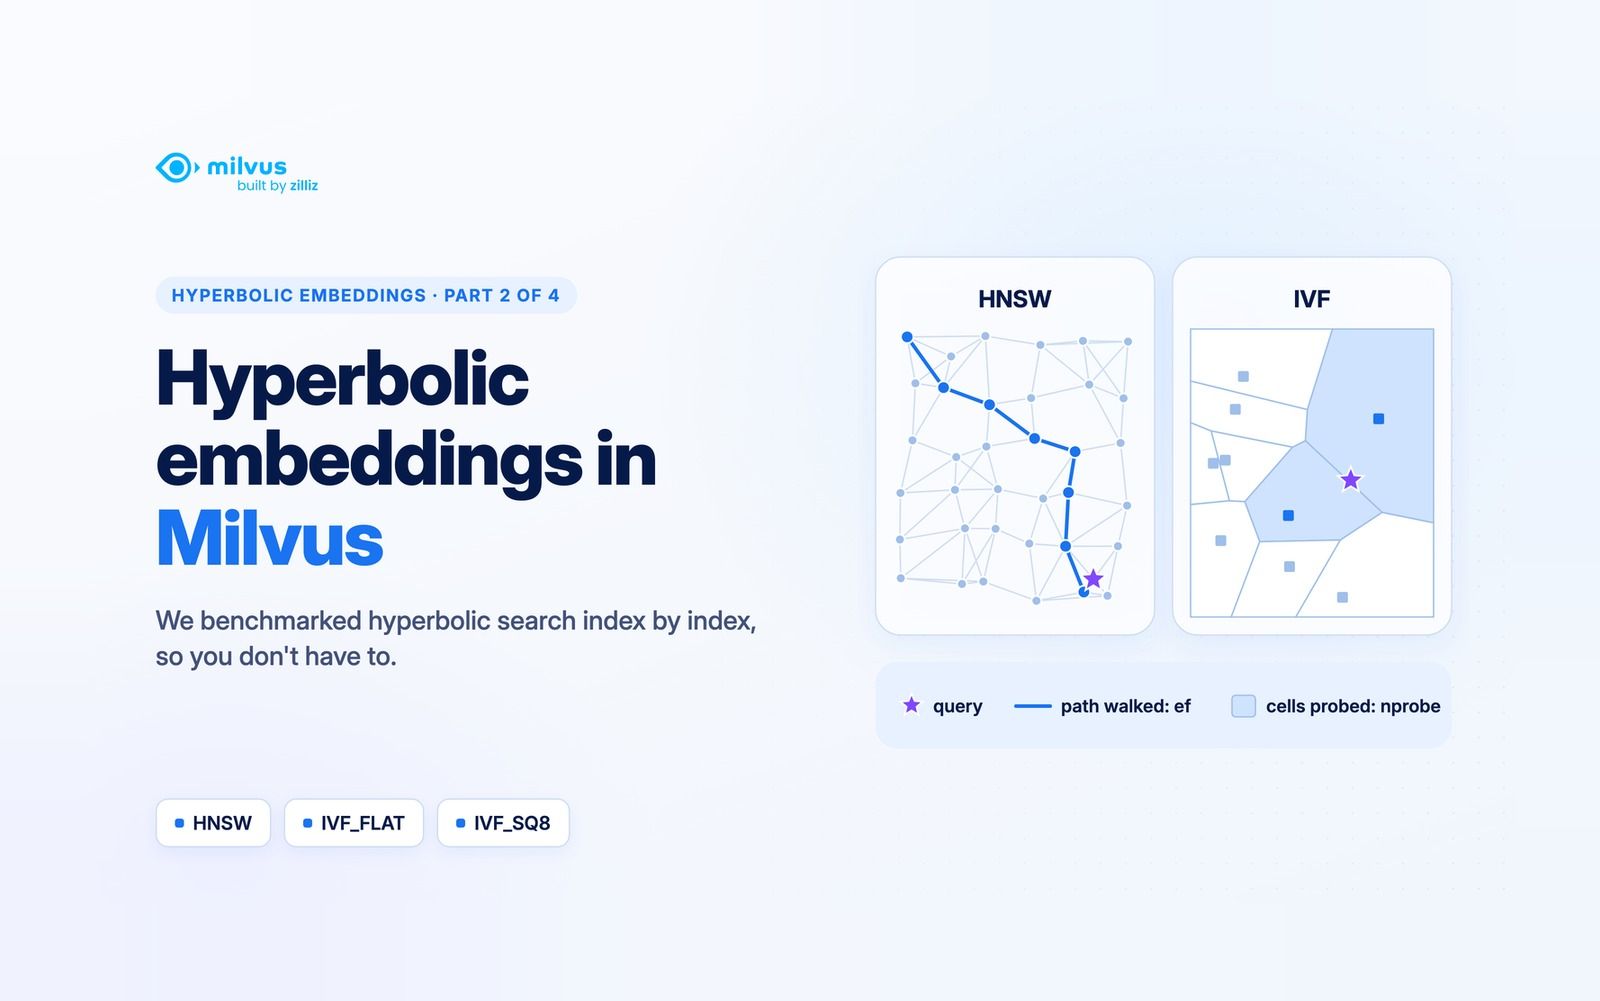
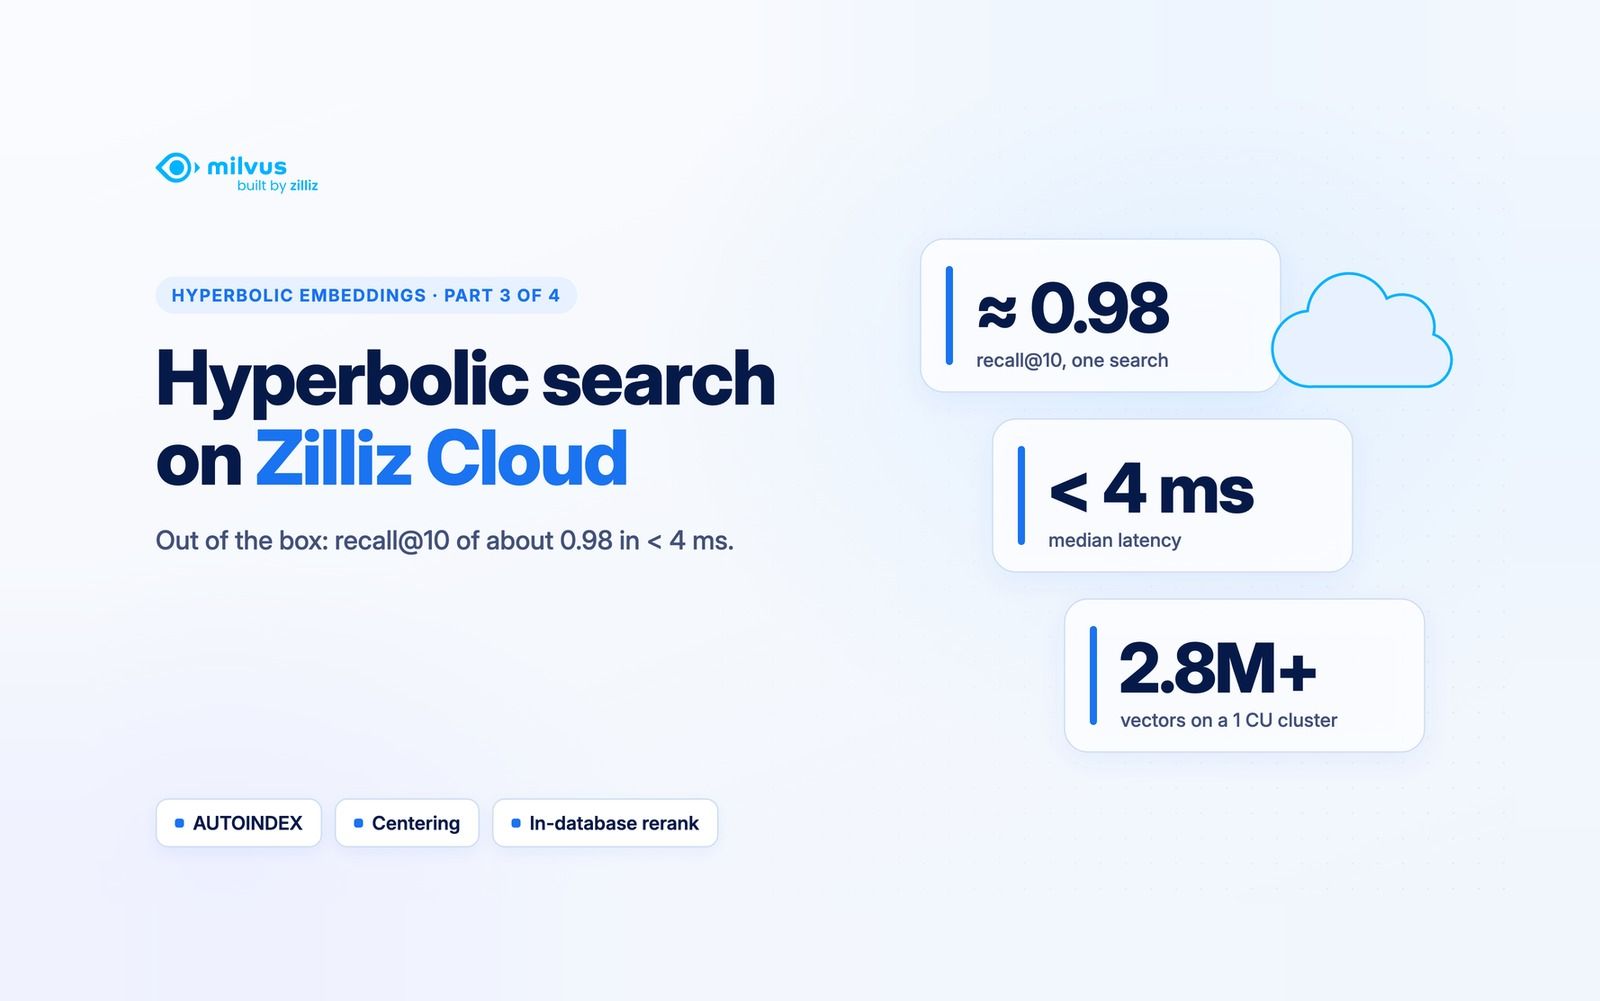
This is part 4 of a four-part series on hyperbolic embeddings in vector search: how to search them in Milvus and Zilliz Cloud with plain inner product, and when they’re worth using. This post compares a hyperbolic model with CLIP to see where it wins and where it loses. Part 1 explains why plain inner product works, and part 2 and part 3 run it on Milvus and Zilliz Cloud.
Parts 1 to 3 show that a vector database can reproduce a hyperbolic model’s ranking with a
plain inner-product index. This post asks whether that ranking is worth having, using
hyper³labs’ Hyper3-CLIP V1
(hyper3labs/hyper3-clip-v1), the
checkpoint they recommend; their Hyper3-CLIP paper[1] reports a sibling model,
Hyper3-CLIP.
In short: against OpenAI’s CLIP, a flat model of similar size, Hyper3-CLIP V1 is better at compositional captions and at finding the right photo for a caption. It is worse at finding the right caption for a photo, at ImageNet classification and on our broad-term search, where most of its losses come from rare words such as “elasmobranch” that it doesn’t recognize. Within V1, scoring with the full hyperbolic geometry rather than direction alone makes classification about one point more accurate and scores slightly better on the paper’s hierarchy metrics, but it ranks broad-term searches lower. A hyperbolic model is worth testing if your queries are descriptive captions searched against images. The evidence for broad searches such as “bird” is mixed, and the geometry does not make wrong answers land nearer the right one: the hierarchy metrics improve along with accuracy, and on its mistakes alone Lorentz does slightly worse than cosine.
As a reminder, Hyper3-CLIP V1 places text and images on a bowl-shaped surface, the Lorentz hyperboloid, with general concepts near the center and specific ones further out. Most tests here use ImageNet,[2] about 1.28 million images in 1,000 categories arranged in WordNet’s “is a kind of” hierarchy.[3]
Against a flat model
Hyper3-CLIP V1 can score a match in three ways from the same vectors: Lorentz (the full hyperbolic geometry), cosine (direction only, ignoring the distance from the center) and cone (whether a result sits further out than the query in roughly the same direction, where the more specific things under a broad concept sit; used to rerank a shortlist). We compared it with OpenAI’s CLIP ViT-B/16.[4] Our test harness reproduces both SugarCrepe[5] scores on V1’s model card exactly (0.7954 for V1, 0.7306 for CLIP).
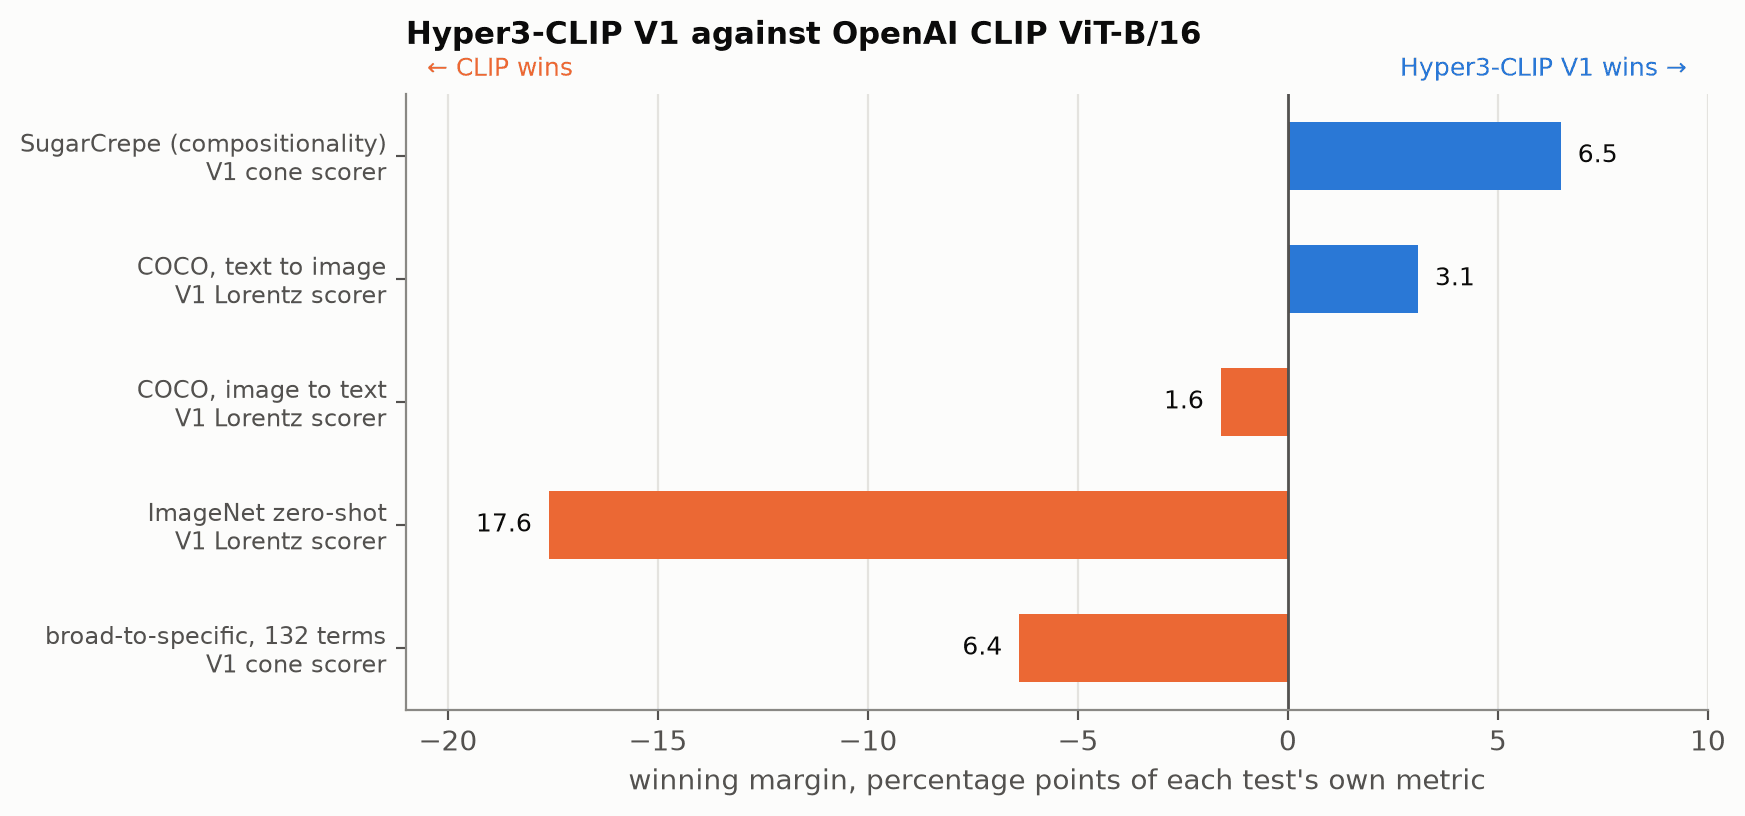 Each bar is one test. Bars to the right are Hyper3-CLIP V1 wins, bars to the left CLIP wins, and length is the margin in that test's own metric, so compare directions rather than lengths across rows.
| Test | What it measures | V1 scorer compared |
|---|---|---|
| SugarCrepe | compositionality: telling the right caption from one with an object, attribute or relation changed (“a dog on a sofa” vs “a sofa on a dog”) | cone |
| COCO,[6] text to image | does the right photo come first for a caption? | Lorentz |
| COCO, image to text | does the right caption come first for a photo? | Lorentz |
| ImageNet zero-shot | classifying images into 1,000 categories with no task-specific training (CLIP 68.64% against 51.06%) | Lorentz |
| Broad-to-specific retrieval | finding every image under a broad term, such as “bird” | cone |
V1 wins where its model card says it does. The ImageNet gap needs context: the Hyper3-CLIP paper trains all its baselines, CLIP included, from scratch on the same dataset (GRIT), whereas we used OpenAI’s own CLIP, trained on roughly 400 million image-caption pairs. Our results are for context, not a verdict on model performance. CLIP also scores better on the paper’s hierarchy measure, TIE (defined below), at 1.73 against 2.75 where lower is better, partly because TIE rewards plain accuracy.
Broad-to-specific retrieval is our own test. We ask for every image under a broad term and score the ranking by average precision (AP, how high up the list the relevant results appear). The terms are every ImageNet category with 5 to 300 classes beneath it, 132 in all, fixed before scoring.[7] CLIP leads by 6.4 AP points (95% confidence interval 2.1 to 10.8).
That lead comes from a few terms rather than a general shortfall. For the median term the two models are within 0.3 points, but on rare taxonomic terms such as “elasmobranch” and “bovid” every V1 scorer finds almost nothing, while CLIP scores above 85. We reworded 12 of these terms in plain English, such as “shark or ray” for "elasmobranch".[8] On 8 of them V1 went from an AP of at most 33 to between 47 and 97, level with CLIP on several. For those, the problem is vocabulary, not geometry. The hoofed mammals are the exception: “hoofed mammal” still finds nothing for V1, while CLIP scores 93. V1’s results also depend more on wording than CLIP’s: asking for “armament” rather than “weapon” took V1 from 79 to 0, while CLIP rose from 29 to 70.
hyper³labs ran a related test on a different dataset: 2,953 COCO test images, three broad queries ("animal", "vehicle", “food”) and their 28 child categories ("dog", "bus", “pizza” …), scored by AP over the full set. This is their evaluation, run on September 12 2026; we re-ran its check on the saved embeddings, not the model. Queries were typed either bare (“dog”) or as "a photo of …":
| mean AP (%) | bare, broad | bare, specific | "a photo of", broad | "a photo of", specific |
|---|---|---|---|---|
| CLIP ViT-B/16 | 73.64 | 68.21 | 76.81 | 71.25 |
| V1 cosine | 81.65 | 75.63 | 79.50 | 72.49 |
| V1 Lorentz | 79.94 | 74.79 | 77.70 | 72.26 |
| V1 cone | 81.74 | 75.42 | 79.73 | 72.25 |
Here every V1 scorer beats CLIP on average. The margin depends on wording: Lorentz leads by 6.3 to 6.6 points with bare queries and by 0.9 to 1.0 with "a photo of". CLIP still wins some individual queries (bare “food” and "dog", and “animal” with “a photo of”), and its top 20 results for a broad query cover more child categories. The test is small, with three broad concepts and no confidence intervals, and it measures full AP on a multi-label set rather than AP over the top 500 of 1.28 million images. It sits alongside the ImageNet result rather than overturning it. On both datasets, V1’s cosine scorer beats its own Lorentz scorer on broad queries.
What the geometry itself changes
Comparing V1’s Lorentz scorer with its own cosine scorer isolates the geometry: same weights, same images, and the only difference is whether the distance from the center counts. Lorentz does better on accuracy and on the hierarchy metrics, and worse on broad-term search.
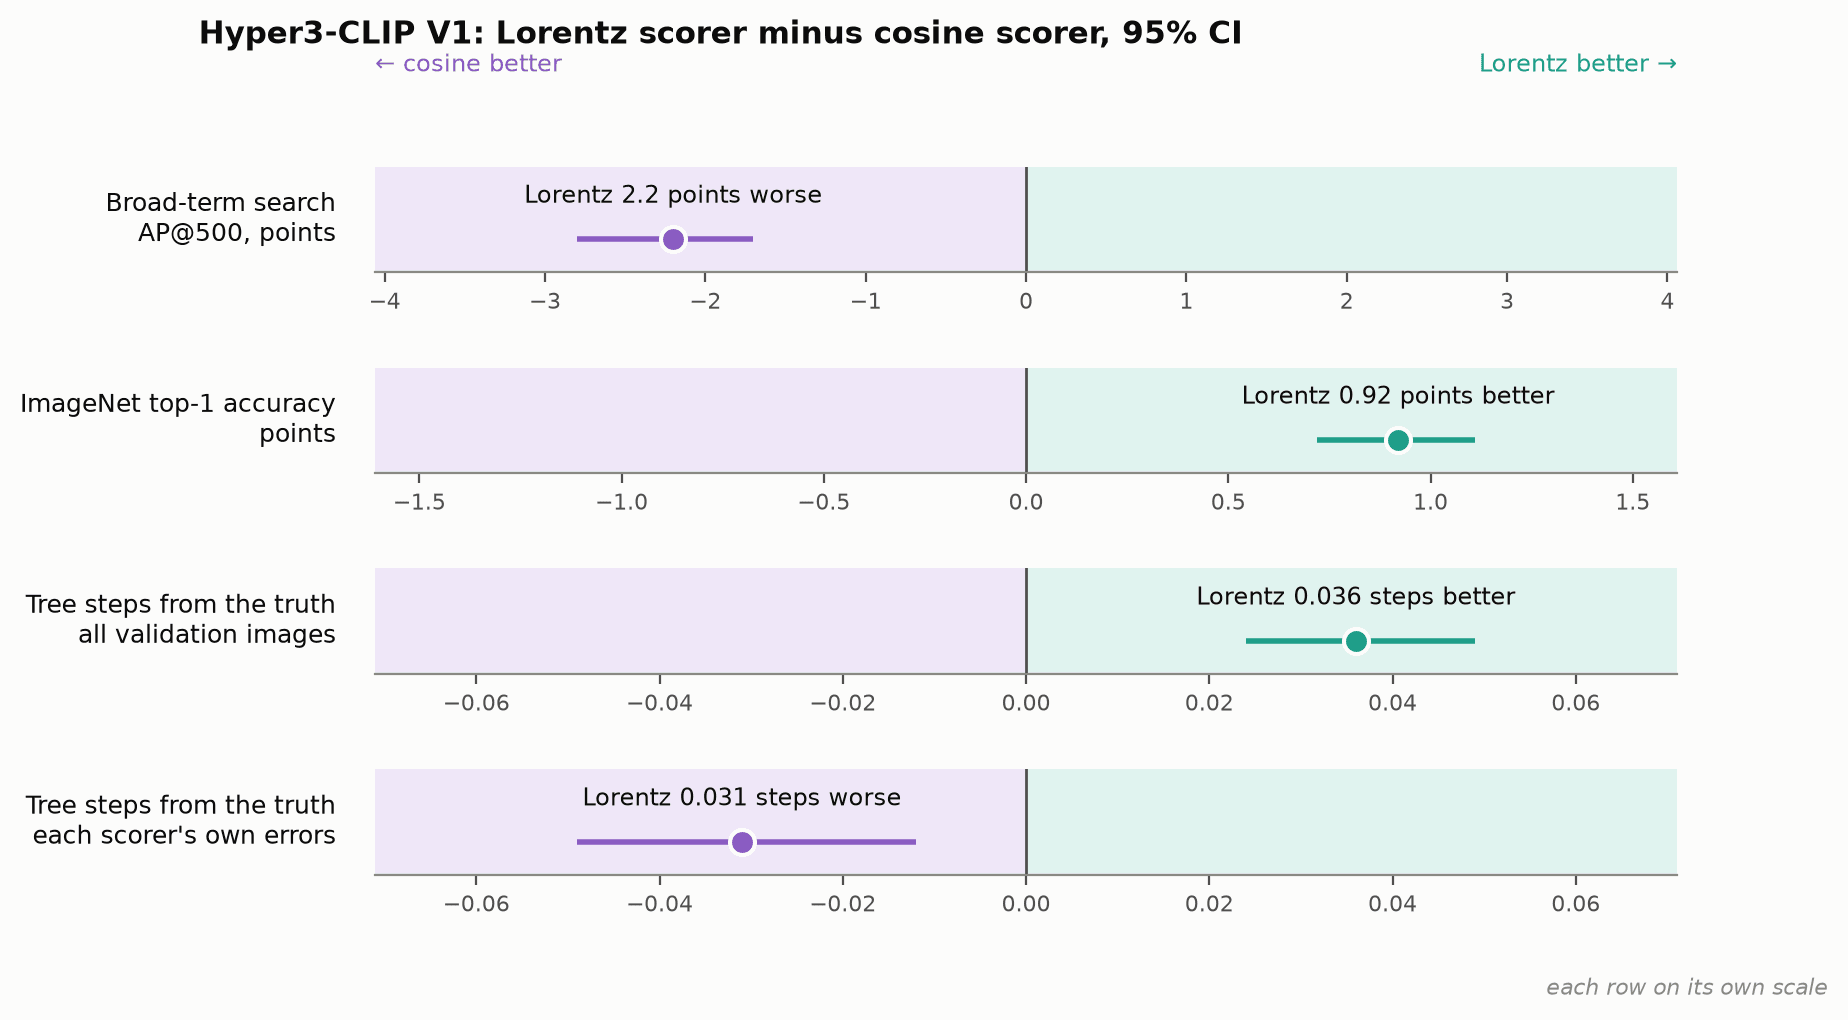 Each row compares Lorentz with cosine on one measure; right always means Lorentz is better, and each row has its own scale. An interval that clears zero is a real difference.
The Lorentz score combines how well the directions match, weighted by how far both points sit from the center, with a term that depends only on those distances. Cosine keeps only the direction match. The gaps below are measured on these ImageNet tasks; they don’t explain why Lorentz ranks the way it does.
The math, for the curious
Writing the score with radius and angle:
The first term depends only on the two radii, not the angle , and grows more negative as the document’s radius grows. The second is the direction match, weighted by both radii. The cosine scorer keeps only .
Broad-term search. On the 132 broad terms, Lorentz scores 2.2 AP points below cosine (95% confidence interval 1.7 to 2.8) and lower on 97 of them. The two scorers build their queries from prompt templates slightly differently, but giving cosine the Lorentz query moved its AP by only 0.01 points.[9]
Hierarchy metrics. The Hyper3-CLIP paper measures how far a wrong classification lands from the right answer in the WordNet tree: calling a husky a malamute is a better mistake than calling it a teapot.
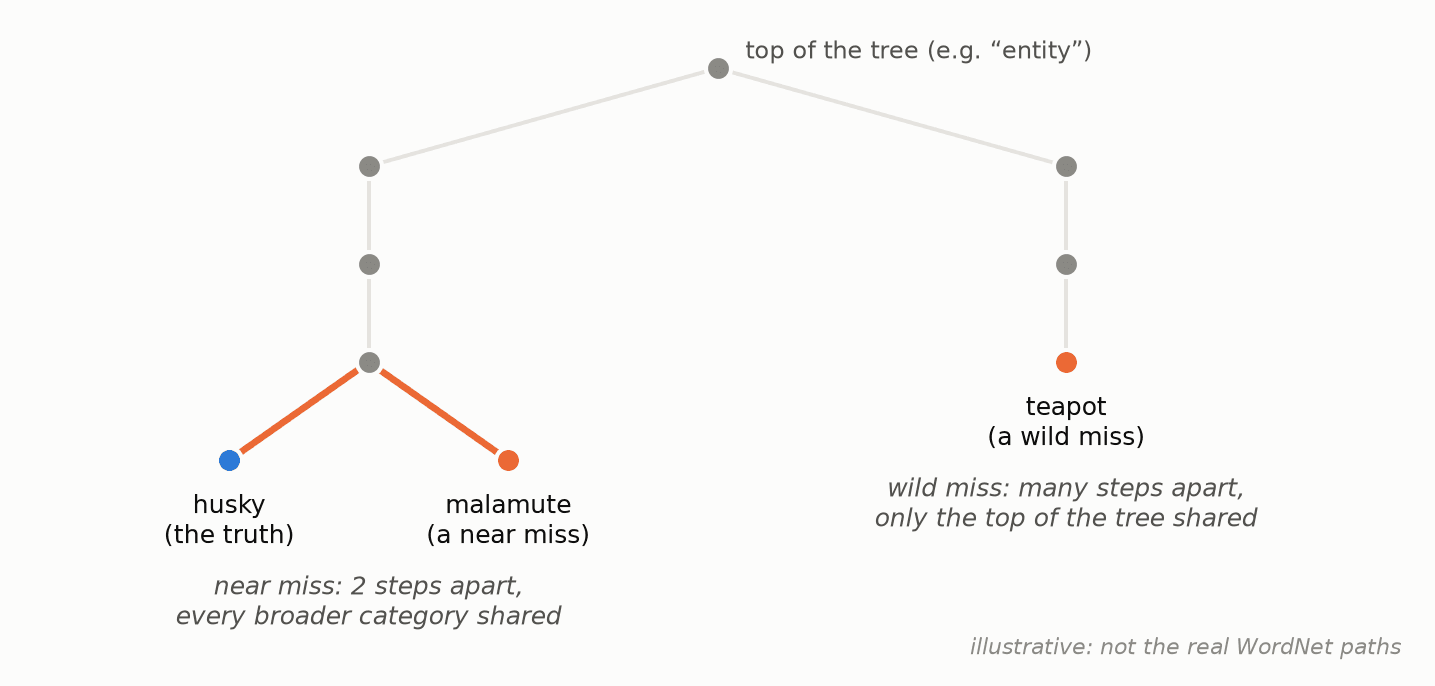 Not all wrong answers are equally wrong. A guess that lands close in the tree (malamute) is a better mistake than one far away (teapot).
We used the paper’s five metrics, with the authors’ definitions, on the 50,000 ImageNet validation images.
The five hierarchy metrics
Each compares the guess with the truth in WordNet’s “is a kind of” tree.
- TIE (tree-induced error): the number of steps through the tree from the guess to the truth. Lower is better.
- LCA (lowest common ancestor): how many of the guess’s ancestors (the broader categories above it) the truth does not share, plus one. Lower is better.
- J (Jaccard): the overlap between the two sets of ancestors, as a share of all the ancestors of either. Higher is better.
- H-P (hierarchical precision): the share of the guess’s ancestors that the truth shares. Higher is better.
- H-R (hierarchical recall): the share of the truth’s ancestors that the guess shares. Higher is better.
| Hyper3-CLIP V1 scorer | top-1 accuracy (%) | TIE ↓ | LCA ↓ | J ↑ | H-P ↑ | H-R ↑ |
|---|---|---|---|---|---|---|
| V1 Lorentz | 51.06 | 2.755 | 1.888 | 0.841 | 0.892 | 0.892 |
| V1 cosine | 50.14 | 2.791 | 1.903 | 0.839 | 0.890 | 0.891 |
Lorentz raises top-1 accuracy from 50.14% to 51.06% (95% confidence interval for the gain, 0.72 to 1.11 points) and improves all five metrics. A correct answer scores perfectly on each, so these metrics mix accuracy with where the mistakes land. Looking only at each scorer’s own mistakes, cosine’s land slightly closer: 5.598 tree steps against 5.629, a difference of 0.031 (95% confidence interval 0.012 to 0.049). Those are different sets of images, so this doesn’t cancel the overall gain. Both effects are small: about 1.3% on TIE overall, and about 0.55% on the errors.
When to consider a hyperbolic model
On one model and one main image collection, the evidence points this way:
- Worth testing if your queries are descriptive captions searched against images, or depend on how objects, attributes and relations combine (“a dog on a sofa”). Those are the tests V1 won.
- Unproven for broad-term search (“show me every bird”). CLIP won on our 132 ImageNet terms, V1 won on hyper³labs’ three COCO concepts, and within V1, ignoring the distance from the center scored better than using it. Most of CLIP’s lead came from rare technical words, so if your users search with specialist vocabulary, test V1 on those words first.
- Not on this evidence for zero-shot classification against a model trained on far more data: OpenAI’s CLIP led on ImageNet by 17.6 points.
If you do adopt one, keep the hyperbolic score for its accuracy point, but don’t count on it to make the remaining mistakes land nearer the right answer.
The database is not the obstacle: parts 1 to 3 run these vectors on a plain inner-product index in Milvus and Zilliz Cloud. Trying a hyperbolic model does mean re-encoding your collection, but once that is done the Lorentz and cosine scores come from the same embeddings, so you can compare both geometries on your own queries.
Limits
These results cover one model, Hyper3-CLIP V1, rather than the Hyper3-CLIP model in the paper. The broad-to-specific test is our design, not the paper’s, and the hierarchy comparison is between two scorers on V1, not against the paper’s baselines, so none of this tests the paper’s hierarchy claim. For speed, the ImageNet retrieval test encoded images in fp16 and computed the geometry in fp32, which agrees with a full fp32 encode with a top-10 overlap of 0.999. COCO and SugarCrepe are fp32 throughout and are the numbers to compare with published work; the hierarchy metrics also use an fp32 encoding.
Mahmood, Matin; Rueda-Toicen, Antonio; ElBassat, Mohamed; et al. (2026). “Hyper3-CLIP: Hierarchy-Conditioned Hyperbolic Vision-Language Training”. arXiv:2608.29313. ↩
Deng, Jia; Dong, Wei; Socher, Richard; et al. (2009). “ImageNet: A Large-Scale Hierarchical Image Database”. 2009 IEEE Conference on Computer Vision and Pattern Recognition. pp. 248–255. doi:10.1109/CVPR.2009.5206848. ↩
Miller, George A. (1995). “WordNet: A Lexical Database for English”. Communications of the ACM. 38 (11): 39–41. doi:10.1145/219717.219748. ↩
Radford, Alec; Kim, Jong Wook; Hallacy, Chris; et al. (2021). “Learning Transferable Visual Models From Natural Language Supervision”. Proceedings of the 38th International Conference on Machine Learning. PMLR. Vol. 139. pp. 8748–8763. arXiv:2103.00020. ↩
Hsieh, Cheng-Yu; Zhang, Jieyu; Ma, Zixian; et al. (2023). “SugarCrepe: Fixing Hackable Benchmarks for Vision-Language Compositionality”. Advances in Neural Information Processing Systems 36, Datasets and Benchmarks Track. arXiv:2306.14610. ↩
Lin, Tsung-Yi; Maire, Michael; Belongie, Serge; et al. (2014). “Microsoft COCO: Common Objects in Context”. Computer Vision – ECCV 2014. Lecture Notes in Computer Science. Vol. 8693. pp. 740–755. doi:10.1007/978-3-319-10602-1_48. arXiv:1405.0312. ↩
An earlier version used 14 broad terms we picked by hand. Re-scored the same way, those 14 give the opposite verdict: V1’s cone scorer leads by 5.9 points (95% confidence interval 0.5 to 12.0). A short, hand-picked list can flip on details of the test, so we fixed the list by rule. ↩
We re-ran the same search with one plain-English paraphrase in place of each term, scored against the same images. We chose the 12 terms because V1 failed on them, so this explains those failures but does not re-score the 132-term comparison. Two paraphrases, “device for fastening things together” and "bird hunted for sport", failed for CLIP too, so they tell us nothing about V1. ↩
Each query averages several prompt templates ("a photo of a bird", “a picture of a bird” …). The Lorentz query averages the model’s raw 512-number output for each template and places the average on the hyperboloid, as the model’s authors specify. The cosine query follows the usual CLIP convention: scale each template’s vector to length 1, average, and rescale. The two versions point 0.4° apart on average, and re-running cosine on the Lorentz version moved AP by 0.01 points, with every difference in this section still holding. ↩
- Against a flat model
- What the geometry itself changes
- When to consider a hyperbolic model
- Limits
On This Page
Try Managed Milvus for Free
Zilliz Cloud is hassle-free, powered by Milvus and 10x faster.
Get Started




Like the article? Spread the word